DataFrame to HTML
This node takes a tabular DataFrame and renders it as an HTML table element. You can cap the number of visible rows and columns and choose whether to include the index column. The output is a plain HTML string that can be embedded into dashboards, reports, or downstream HTML-aware nodes.
Usage
Use this node when you have a DataFrame and need a human-readable HTML table representation—for example, embedding a summary table into an email, web view, or report. It typically appears downstream of nodes that create or transform DataFrames, such as CSVToDataFrameNode, JsonToDataFrameNode, or ConcatenateDataFramesNode. Upstream, connect any node that outputs a DATAFRAME; downstream, connect nodes that display or transmit text/HTML (such as text renderers, HTTP response builders, or report generators). Set max_rows and max_cols to keep tables compact in UIs or chat responses; set them to 0 to show all rows or columns. Enable show_index when the DataFrame index has semantic meaning (for example, dates or IDs), and disable it when the index is just a positional counter. This node is best used for lightweight visual inspection; for richer reporting, pair it with higher-level table or report output nodes.
| Field | Required | Type | Description | Example |
|---|
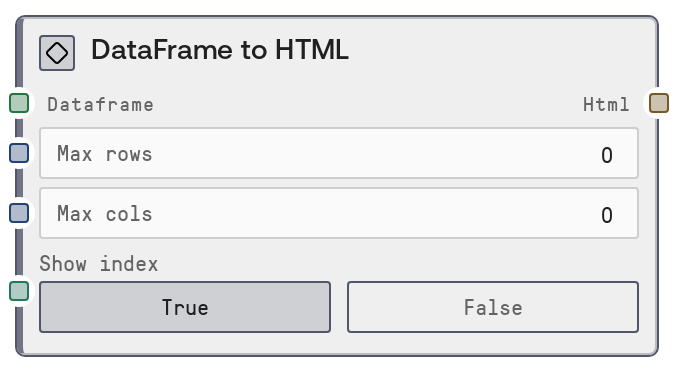
| dataframe | True | DATAFRAME | The DataFrame to convert to HTML. Must be a valid DataFrame object produced by upstream table nodes. Columns may contain numeric, string, or mixed types; they will be stringified for display in the HTML table. | A DataFrame with columns ['date', 'user', 'sessions'] and 100 rows of daily analytics data. |
| max_rows | False | INT | Maximum number of rows to display in the HTML table. If 0, all rows from the input DataFrame are shown. Must be between 0 and 10000. When the DataFrame has more rows than this value, only the first max_rows rows are included in the output. | 20 |
| max_cols | False | INT | Maximum number of columns to display in the HTML table. If 0, all columns are shown. Must be between 0 and 1000. When the DataFrame has more columns than this value, only the leftmost max_cols columns are included. | 8 |
| show_index | False | BOOLEAN | Whether to include the DataFrame index as a separate column in the HTML table. Set to true when the index carries information (such as timestamps or identifiers); set to false to hide it for cleaner display. | true |
Outputs
| Field | Type | Description | Example |
|---|
| html | STRING | An HTML string containing a table element that represents the (optionally truncated) DataFrame. It includes table headers for each column and, if show_index is true, a leading index column. The table has a border and a 'dataframe' CSS class for basic styling hooks. | | date | user | sessions |
|---|
| 0 | 2024-01-01 | alice | 12 |
|---|
|
Important Notes
- Performance: Very large DataFrames can produce huge HTML strings; use max_rows and max_cols to keep output manageable for UIs and network transfers.
- Limitations: This node only produces raw HTML for the table content; it does not add surrounding html, head, or body tags or any CSS or JavaScript resources.
- Behavior: When max_rows or max_cols are set and the DataFrame exceeds those limits, only the top rows and leftmost columns are included; no explicit truncation message is embedded in the HTML.
- Behavior: The index column appears as the leftmost column when show_index is true; when false, it is completely omitted from the rendered table.
Troubleshooting
- Common Error 1: Missing or invalid DataFrame input – Ensure this node is connected to an upstream node that outputs a DATAFRAME (such as CsvToDataFrameNode, JsonToDataFrameNode, or ConcatenateDataFramesNode) and that the connection type matches.
- Common Error 2: HTML output is extremely long or slow to render – Reduce max_rows and max_cols to limit the size of the generated table, especially for DataFrames with thousands of rows or many columns.
- Common Error 3: Index column cluttering the table – Set show_index to false if the index is just a 0..N-1 counter and does not carry semantic meaning, then regenerate the HTML for a cleaner view.