Inspect
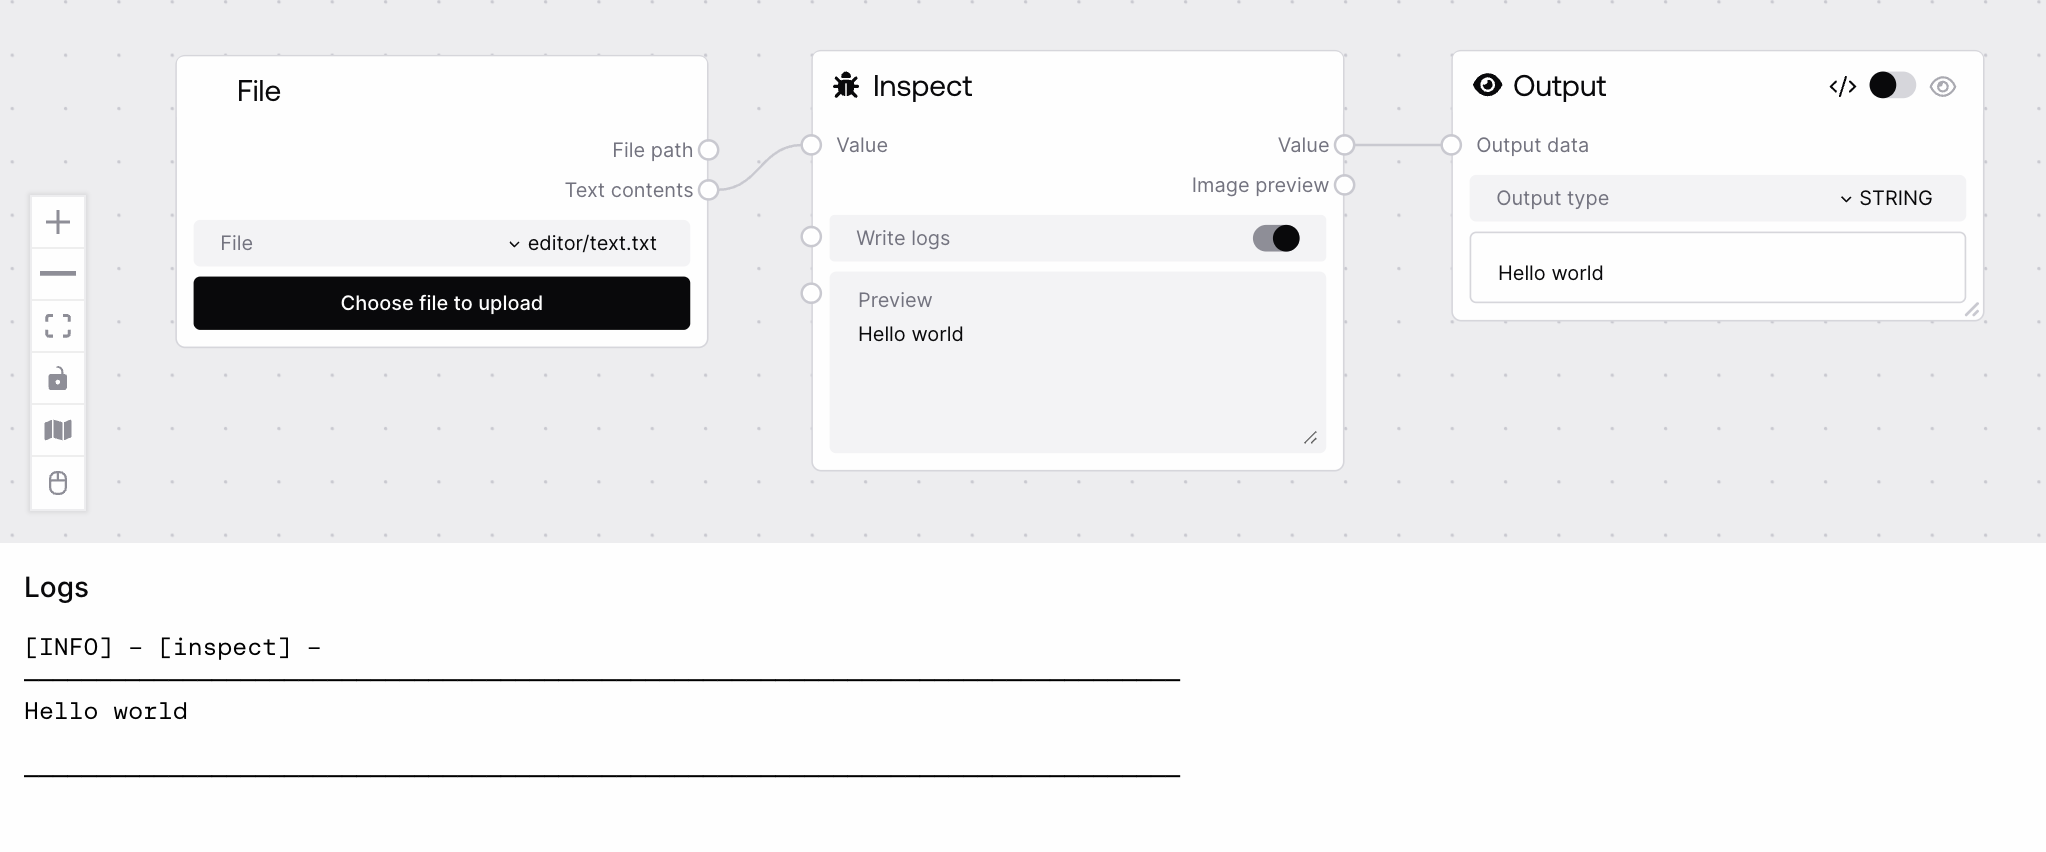
Node for inspecting and logging data flowing through the workflow. Displays a visual preview and logs information about the input value.
Quick Start
- Add the Inspect node to your workflow.
- Connect any node output to the Inspect node's input.
- Run the workflow to view inspection results and image preview.
Setup Guide
1. Add Node to Workflow
- Locate the Inspect node.
- Drag it into your workflow editor.
2. Connect and Configure
- Connect the output you want to inspect to the Inspect node's input.
- Optionally, toggle logging with the write_logs input.
Basic Usage
Inspecting Data
- Use to debug or visualize any data flowing through your workflow.
- Supports tensors, images, JSON, and strings.
- Preview images are auto-extracted if possible.
Configuration
Required Inputs
| Field | Description | Type | Example |
|---|---|---|---|
| value | The value to inspect | Any | 42, "text", tensor |
| write_logs | Enable/disable logging | Boolean | True |
Optional Inputs
None
Outputs
| Field | Description | Example |
|---|---|---|
| value | Inspected value (as string/JSON) | "42", "{...}" |
| image_preview | Preview image tensor | tensor |
Best Practices
Debugging
- Use Inspect nodes at key workflow points to monitor data.
- Enable write_logs for detailed logging during development.
Visualization
- Use the image preview to quickly verify image data.
- Chain multiple Inspect nodes for stepwise inspection.
Troubleshooting
Common Issues
- No image preview: Input data may not be an image or valid base64 string.
- Unreadable output: Non-JSON or complex objects may be stringified.
Need Help?
- Check workflow logs for error messages.
- Review input data types for compatibility.